A short post to show a powerful graph!
In giving feedback to my students following their recent physics test I had 2 goals. 1) Give them some direction as to what to practice next, 2) Find out how they’d prepared, and hopefully demonstrate to them (beyond me just telling them over and over again) the importance of doing practice questions (i.e., retrieval practice).
I knew I was going to hand back my student’s papers in the same way I always do (photocopy prior to marking, hand them the photocopied version for us all to go through together in class, I’ve written about it before here). But I also wanted to achieve the two goals stated above more so than is afforded by this approach alone. I’d read some tweets from various people about exam wrappers, and I thought I’d give it a go.
Here’s what I came up with (you can click the ‘next’ button down the bottom to see the 2nd page, but I’ve included the 7 final questions later on in this post too).
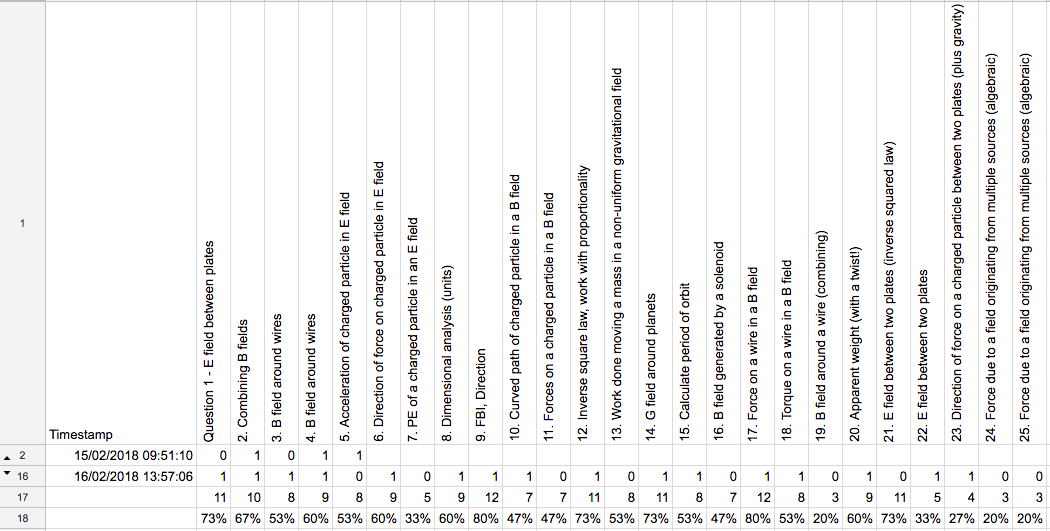
As you can see, the first section was all about helping them to identify weak points in order to direct future practice (concepts clearly outlined in relation to each question). I got students to jot down the concepts they struggled with, but the main way that I used this info was to feed into progress checks for the following three weeks (see more on that here). This is as I was able to do an easy item analysis and work out what percentage of the class got each question correct, as is pictured below. And yes, percentages are pretty low, my philosophy with Y12 physics is to go slightly harder than end of year exam standard so when they get to the end of year exam, it’s hopefully a relative breeze (% correct pictured in row 18, rows 3-15, with student responses, hidden).
The really interesting thing was the students’ responses to the final 7 questions. Here they are:
- How many hours do you usually spend studying for physics in a week. This is in a normal week, not when there’s a SAC on? Enter a number of hours.
- On top of the number above, how many additional hours did you spend preparing for this SAC? (To work this out: Look back through your diary, look at the days that you studied, consider how many hours you studied on each day, then add it up)
- How many hours did you spend doing practice questions for this SAC?
- How many practice questions do you think you did to prepare for this SAC? (Look back over your study resources and count up the questions)
- How many questions (if any) did you RE-DO in preparation for this SAC? E.g., you got a question wrong, marked it somewhere, then re-did it later.
- How many hours did you spend re-reading notes, writing summaries, or writing your formula sheet for this SAC? (writing based activities?)
- FINAL QUESTION: How much effort do you think you put in in preparing for this SAC. 10 is 100% effort, 0 is 0% effort. (Likert scale, 0 to 10).
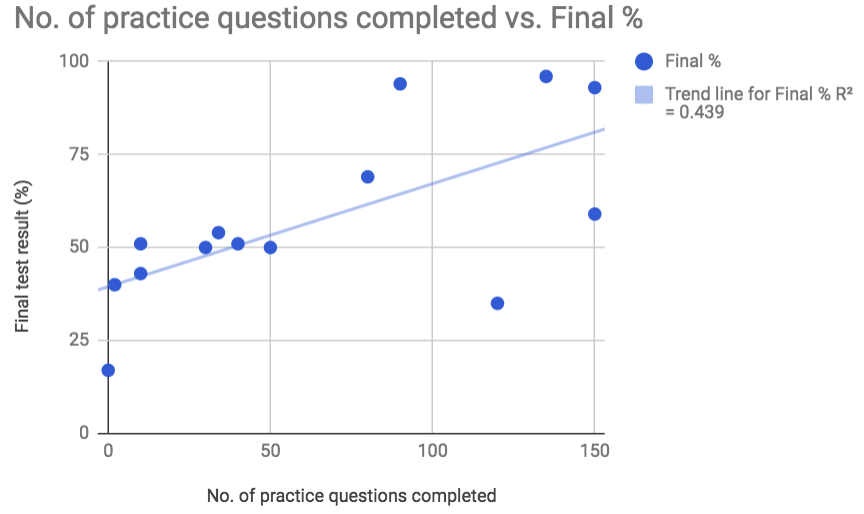
The test wrapper was anonymous, but I also got students to enter their test percentage. What this allowed me to do was regress their test results against each of the variables. Each of the variables, except for no of practice questions re-done (no. 5) was positively correlated with test outcome, but one variable really stood out. Here’s how number of practice questions was associated with test outcome.
And here’s the message that I communicated to students based upon this (in tandem with showing them the graph).
- Every student who got a B or higher did at least 80 practice questions.
- Every student who got an A or higher did at least 90 practice questions.
- 43.9% of the variation in SAC results can be explained by variation in the number of practice questions that students did.(based upon the R^2 value)
The idea was that this graph would show students, 1) That practice questions REALLY matter (just as I’ve been telling them all along), 2) How much practice some of their fellow students are doing, ‘OMG, who the heck does 150 questions???
Of course, some astute readers will notice the two students who did 120 and 150 practice questions, and got around 30% and 57% respectively. But that’s helpful info also, this tells me that there are some students in the class who are potentially not doing practice problems in a way that’s truly retrieval practice (maybe they’re reading the solutions rather than doing the questions), so a next step is for me to try to track down these students, or invite them to have a discussion with me, about how they could potentially improve the efficiency of their study.
There are, of course, problems with this type of analysis. It’s all based upon student self-reporting, and we know that that’s reliably unreliable (see this fascinating study!). It’s also completed after students have their results back, so there’s an incentive for them to construct a post-hoc self-handicapping narrative around their test results. None the less, it gave me a powerful graphic to show them as a basis for a discussion on the importance of retrieval practice, it showed to students how much work some of their classmates are doing, and it helped me to identify some students who perhaps need some additional support in regards to getting the most out of their practice problem study.
Feel free to use the graph with your students, and I’d be very interested to hear of the results of any other such classroom experiments if you have done them, or are prompted to do them via this post. The narratives we weave around this kind of small data, I think, can be powerful tools for influencing our own, and our students’ understandings of effective learning.
Appendix.
Below are the variables and the R^2 values of each of the variables, in case anyone is interested.
- Hours of physics study in a usual week, R^2=0.001
- Hours prepping for SAC,R^2=0.149
- Hours on practice Qs,R^2=0.178
- Hrs on notes,R^2=0.314
- No of practice Qs,R^2=0.439
- No of Qs re-done,R^2=0.003 (negative correlation)
- Effort,R^2=0.337