This post is the story of one passionate educator trying to honestly work out whether effect sizes are worth the prominence they currently enjoy in educational research, or whether they’re a complete waste of time.
About six months ago now I came across a paper entitled ‘The misdirection of public policy: Comparing and combining standardised effect sizes’ by Adrian Simpson. In the paper, Adrian wrote about three factors that influence effect sizes, yet have nothing to do with the efficacy of the educational approach being studied. These three factors are: unequal comparison groups, range restriction, and measurement design. Adrian’s paper suggested to me that I had been placing far too much faith in aggregated effect sizes, and I felt a bit of a sinking feeling in my stomach as I thought back to all the times I’d cited them as support for various educational approaches. I invited Adrian onto the ERRR to explore these ideas in more detail. To ensure that I wasn't just listening to one side of the argument, I invited John Hattie on to the following episode to respond to Adrian's critique.
Since sharing my discussions with Adrian Simpson and John Hattie via the Education Research Reading Room podcast, I’ve had two main questions from colleagues, friends and listeners. The first is for more clarification about Adrian’s arguments, as some found them hard to get their heads around in podcast form. The second is ‘so, what do you think now?’. This post aims to respond to both of these questions.
In the following, and in an attempt to provide additional opportunities for people to consider them, I summarise Adrian’s three arguments with different examples from those provided by Adrian. I follow these summaries up with excerpts from the John Hattie interview relevant to the point under discussion, I then add my own thoughts and reflections on both Adrian's critiques and John's responses.
A quick recap of effect sizes
An effect size (D) is normally calculated as follows:
D= (Intervention group mean – Control group mean) / Pooled standard deviation
All of Adrian’s arguments centre around different ways in which a simple change to an experimental design can change the size of D, without changing the efficacy of an intervention.
Three ways that effect sizes can be influenced, without changing the intervention itself
—–Unequal comparison groups
The Argument: This argument is quite intuitive. At its simplest, an effect size is a measure that compares how well an intervention group fares relative to a control group. As this is a relative metric, the worse the control group does, the better the intervention group looks. If two studies use different control groups, it makes little sense to compare or combine their effect sizes.
Example: Who is more generous to charity, an Australian Teachers or English teachers? Say we survey 10,000 Australian teachers and calculate average their annual donation as $780. We do the same in England and find the number is $810 (also in AUD) per year to charity? Who is more generous depends, of course, on what we compare each person's donation to. If we compare them both to the global average, then the English teachers will come out on top because, in absolute terms, they donate more. However, if we compare them both to their respective national averages, then the Australians seems more generous because their donation beats their national average ($764, ref), whereas the English teachers' donation is below their national average ($849, ref). Changing the comparison can change the result.
The peculiarity of unequal comparison groups really comes to the fore when we try to answer the question ‘Are teachers generous?'. Here we could say that the Australian teachers donates $16 more than the average person (when compared to the Aussie average), and the English teachers donates $39 less than the average person (when compared to the UK average). We aggregate these two ‘studies' and conclude that teachers donate less than the average person, and are thus not very generous, a pretty meaningless finding when you know the data that went into it. Furthermore, changing the comparison again, we could consider the Aussies and the Poms relative to the median donation in their respective countries, and conclude that teachers are saints because their donations approximately quadruple the median donation for both Australia and England (approx. $200). In this quick example it's been demonstrated that, simply by changing the comparison groups, we can justify the conclusions that: The Aussie teachers are more generous, the English teachers are more generous, teachers are stingy, and teachers are generous. Adrian argues that such ambiguity and unreliability arise whenever two non-control-matched studies are combined into a meta-analysis.
My initial response was that this makes intuitive sense and this would severely compromise the use of the effect size as a comparison metric between different studies.
Hattie’s Response: (from 14:38 in the podcast)
JH: ‘One of the things that I’d hope the critics are careful about is that they don’t just look at the effect size and make assumptions. Many of them forget that it took me 20 years to work out what was going on, and to look at those kind of things. Now, one of the sad things is that there are very few meta-analyses that make comparative judgments. And so I think that Adrian’s criticism is quite reasonable, but that isn’t the state of most of the literature. Most of the literature is comparing an influence to not having it… …Now, that’s a deficit of the literature, it makes my job easier however, because most of the comparisons are with having something compared to not having it. Very few, are of the nature that we’re talking about…’
OL: So, to summarise my understanding of what you’re saying: It (unequal comparison groups) can be an issue, but due to the way that studies are generally carried out, it’s generally the case that they compare it to business as usual, therefore aggregating across makes sense.
JH: Yes, but you’ve still got to be very sensitive to that.
Reflections: I was a bit confused by John’s response to this particular point. He says that ‘most of the comparisons are with having something compared to not having it’, but there are multiple ways in which a student can ‘not have’ a given intervention. In the above I mention ‘business as usual’, but business as usual also isn't a well defined condition. Many things such as the country, state, school, and teacher/experimenter in charge of a control group influence what constitutes ‘business as usual'. Perhaps this was what John was referring to when he suggested ‘you’ve still got to be very sensitive to that’?
To explore John’s claim that most control groups are the same, I went to the Evidence for Learning Toolkit (The information regarding which meta-analyses are used to construct John’s updated effect sizes are not freely available) and explored the influence that has the highest evidence security rating, phonics, which was comprised of several meta-analyses. I then selected the first meta-analysis within the list of those included that I could get a copy of (1). From there I went to the first two studies included within that meta-analysis that I could find online (2). I examined the control groups in both of these studies and found that they were vastly different. Here are some of the differences: 1) one study looked at all students in a year group whilst the other dealt only with those who were suspected of having a reading disability, 2) One study compared phonics based instruction to student's usual classroom instruction whereas the other compared it to an alternate intervention, 3) In the ‘business as usual' comparison group the ‘business as usual' actually included a phonetically-based reading, therefore making it a comparison of lots-of phonics vs. a-bit-of phonics.
John suggested that ‘Very few (studies), are of the nature that we’re talking about (having different comparison groups)’, however, using the first-first approach above, I was able to find one of these ‘very few’ studies first time. Of course, I'm not suggesting that I have disproved that it's unlikely by finding an example first time, however, it seems common sense that different experiments designed by different people, at different times, and for different reasons are highly unlikely to have control groups that experience the same conditions. I don't see how John's argument in this case is accurate and therefore have to conclude that unequal comparison groups can, and do, have a measurable impact upon effect sizes.
—–Range Restriction
The Argument: To me this is the least-intuitive of the three factors that Adrian explores. It could be summarised as ‘If you only look at a sub-section of your data, you’re likely to get a different effect size than if you look at the whole population’, but I think it's best explained by means of some examples.
Let’s consider homework. The overall effect size for homework, as represented in Hattie’s most recent data, is D=0.21. However, if we restrict the range of data that we’re looking at and calculate an aggregated effect size for primary school students only, we’re likely to get something around 0.1 (reference), and, if we restrict the range of the data that we’re looking at in another way and calculate an aggregated effect size for high school students, we’ll get something like 0.44 (reference). So, it doesn’t seem to make a whole heap of sense to combine the results from primary and secondary into one effect size, because they’re vastly different, and we actually lose one of the key story elements contained in that data, that homework is likely to have a differential effect on students, based upon their age. (This is assuming range restriction is the only violated assumption within the homework research, there are very likely other factors to do with the way that the impact of homework is measured in primary and secondary that contribute to this differential result) .
Consider a hypothetical example (calculations here). You’re carrying out a mathematics intervention with all of the students in one high school year group. It helps all students equally, boosting each individual's mark by 8 percent. The impact of range restriction is as follows: If all students are taken together, the mean difference is 8 marks and the pooled standard deviation is 23.66, thus the effect size is 0.34. HOWEVER, if the group is split into two cohorts, low (class 1) and high (class 2) achievers, and keeping the intervention exactly the same, the mean difference is still 8 marks, but now the pooled standard deviation is 12.11 per group, thus, the effect size is 0.66 per group. If we use this to calculate an average effect size for the intervention, we end up with D=0.66. Conclusion: Calculating the overall effect size by first calculating the effect size to each group (range restriction), then averaging those values, yields an effect size almost double that of calculating the cohort's D right from the outset (in this case). This magnification of effect size could occur in an example such as this one, or also when multiple smaller studies are used to examine an intervention, instead of one larger study.
Hattie’s Response
OL: Do you think this (range restriction) is an issue that can challenge these meta-analyses
JH (17:26): ‘Well look Ollie, I could go back to the history of statistics and write the textbook about all of the things that you have to be careful with any statistic, including, effect sizes… …I take the comment about splitting it up. Now, in the jargon, that’s the search for moderators. And that is pivotal to what we do in education. And I’ve spent a lot of time and effort to try to find them. The fact that I couldn’t find them, I think is the fascinating part. Not because I didn’t look for them. So, that criticism is an easy criticism to make, but show me the evidence where that is in fact the case. Statistically, of course that can happen, but there’s very few moderators that make a difference to the overall conclusion. If they did, that needs to be screamed out from the front page. But they are just hard to find…. … So yes, if you found them, this argument is correct, if you don’t find them, this argument is moot.’
Reflections: The first thing I noticed when re-reading over John's response was the similarity between this one and his first one. Essentially the argument goes: he's aware of it, theoretically it can make a difference, but when we look at the literature, it doesn't have a measurable effect.
John speaks about moderators, and indicates that they can’t be found ‘I’ve spent a lot of time and effort to try to find them (moderators). The fact that I couldn’t find them, I think is the fascinating part.’ However, in statistics, moderators are any ‘variables that identify the subgroups, conditions, or factors for which the treatment effect on the outcome differs.’ (ref). In his research, he talks about several moderators himself. He speaks about the differential impact of homework on primary and secondary students (moderator: age), in the interview he talks about how inquiry based learning is ineffective for first year medical students, but can be beneficial for third year students (moderator: expertise), and he also speaks in the interview about how in one of the very early meta-analyses on class sizes, Gene Glass demonstrated differential effects depending on range the range of the class size change considered, ‘I go back to the very first meta-analysis of Gene Glass, where he produced a kind of a non-linear relationship from 40 down to 20 in terms of that kind of effect.’ (moderator: sample range). A key moderator that all educators are aware of is student ability (or prior knowledge). Interventions have different effects on students of different ability, we all understand this. As a final illustration of this point, Evidence for Learning (Australian version of the Education Endowment Foundation), in their summary of the research on setting and streaming, present the following table:
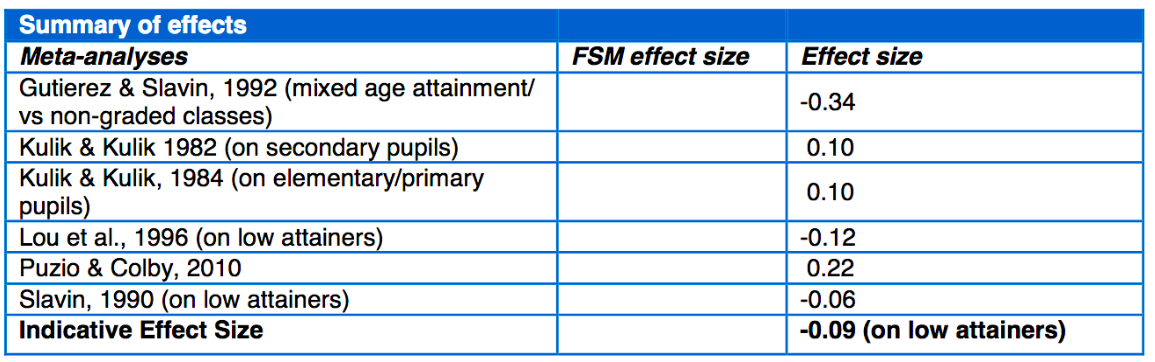
That is, they report the impacts of setting and streaming from multiple studies, then they restrict the range of their analysis based upon the moderator of attainment, which yields an effect size of -0.09. If we chose, instead, to restrict the range to non-low attainers, the average effect size would be 0.02 (based upon this same set of studies). A clear illustration of how range restriction can influence effect size.
As with unequal comparison groups, John suggests that range restriction can have an impact, but when we look at the literature, we see that it doesn't have an impact. From the above examples it’s clear that there are many such moderators, including those demonstrated in John’s own work. It seems apparent to me that range restriction can have an appreciable impact upon effect sizes, and comparing effect sizes without checking for range restriction (along with every other relevant assumption) yields highly unreliable conclusions.
—–Measurement Design
The Argument: Some measures make interventions look better than others. This, as with unequal comparison groups, is a pretty intuitive point. Imagine that you’re trying to demonstrate that your students have an exemplary knowledge of history. You know that some Taiwanese visitors are coming to your school soon, and you want to impress them, so you teach your students all about Taiwanese and Chinese history. When the Taiwanese visitors come along, you say, ‘My students are fantastic history students, ask them any historical question you like!’. The visitors ask, ‘In which year was Taiwan ceded to Japan?’
They’re met with a resounding ‘1895’. This continues until the visitors have run out of historical questions (most of which were related to Taiwan), and your students (and you) emerge victorious. The measure selected to demonstrate competence in this case was very well matched to the intervention, thus, students appear experts. If, however, a different measure was used (such as a test of European history from the 15th till 17th centuries), it would appear as though they’d learnt nothing.
This specific example instantiates the generalisation that experimenter designed/intervention specific tests will consistently generate larger effect sizes than more broad tests, such as standardised tests. If some types of interventions, such as school behavioural policies, are consistently more likely to be measured by means of broad/standardised tests, they stand no chance (in effect size terms) against intervention types that are consistently measured by experimenter designed tests.
Hattie’s Response:
JH (25:21): ‘Yes (it’s an issue), and Bob Slavin has just come out with an article showing the differential effects of the standardised and the teacher made (tests), and we’ve known that for a long long time and I discuss it within the various articles and books. … …And of course if you go back and look at the individual meta-analyses, some of them actually comment on that. And I comment on that. And yes you do have to be careful about it. But certainly when you look at that, and you ask the question, which is what the meta-analysis question allows you to do, ‘Does it make a difference?’, yes it can, overall, not much. Cause most classes don’t use one or the other, they use a mixture.’
Reflections:
Again, when reading over John's response, I recognised the same pattern of argument as with the first two critiques. He acknowledges that 1) He's aware of it, 2) theoretically it can have an impact, 3) when we look at the studies it doesn't have an impact. In this case, he suggests that there's no impact because most studies use a mixture of types of tests. In this instance, he suggests that they’re a mixture of teacher made tests, and experimenter made tests. I’m not sure what he means here exactly as both teacher made tests and experimenter made tests can be equally targeted to the intervention content (as from above, the measurement design impact comes when one test is less targeted than the other, such as in experimenter designed vs. standardised tests).
However, a few minutes later, Hattie gives a perfect example of how measure design can influence effect sizes in a systematic way. This is in relation to professional learning.
JH (35:00): Professional learning, that has been in steep decline since around 1989, 1990. But that’s because, and that’s the key thing ‘what’s the reasoing for it?’, that’s because the early studies on professional learning, teachers beliefs about what happened with kids. Now, they look at student outcomes. So the effect, down effect, is perfectly explainable. And this is the beauty of doing meta-analyses, it enables you to ask these kind of questions, that’s the richness of it.
This example clearly demonstrates that some educational influences are systematically measured in certain ways, and that such methods do have a material impact on effect sizes. It seems quite apparent that measurement design can, and does, have a significant impact on effect sizes reported in meta-analyses.
For the three factors – unequal comparison groups, range restriction, and measurement design – it's clear that the argument ‘it doesn't make a difference', fails to hold. In each case it has been quite easy to find several examples in which these factors clearly do make a difference.
The Final Point: Comparing Effect Sizes is a Category Error
The Argument: Because there are so many factors that can influence effect sizes, and many of these factors depend on experimental design rather than the efficacy of the intervention, comparing the effectiveness of two educational approaches based upon aggregated effect sizes is a category error. As Adrian Simpson suggests in the podcast, it’s the equivalent of trying to compare the ages of two cats, based upon their weights. This isn’t to say that this would never work, if you had two cats of the same breed, with the same exercise regimes, matched diets, and both not as yet fully grown, you could probably make a fairly reliable estimate of which cat was older based upon their weights. In the same way, working out which of two educational approaches is better, based upon which has a larger effect size is only justified if all relevant factors are controlled for. As meta-analyses and meta-meta-analyses do not control for these factors, ranking influences based upon effect sizes is a misguided category error.
Hattie’s Response:
JH (33:00): What’s the alternative when you’re trying to synthesise literature? Yes, I don’t want the one pager to be the bible, there’s a story behind it. I want the story to be there. And I’m constantly going at the story. And I’m now writing I think my twelfth or fourteenth book trying to get the story out. I don’t deny that it’s based on effect sizes, but if you go and look at the work, not only do I use effect sizes, I use a variance around effect sizes, I look at the moderators. And the critics ignore that. And they then create this belief system that it’s all about the one page. It’s not, there’s a whole story behind it, let’s be fair here, take the story. I think it’s quite remarkable that, since I started this, I think it’s 1989 was the first article, no-one’s taken the data and invented a different story. That would be a dramatic advance, and I’d bet the first to welcome it. People have criticised the method, it’s been around now since 1976, there’s lots of critics, most of us are very sensitive to those criticisms, and attend to them. I’m continually doing that, in fact, I spent a week with a colleague from Switzerland a few weeks ago re-coding everything to take into account some of those things. But the message, the story hasn’t changed. The details might, but the story hasn’t changed. And so I think you can take these messages, you can have a statement about public policy, about what happens in schools, and what keeps me going is the schools around the world that are implementing the story from this. Wow, that’s exciting.
Final reflection and conclusion
In the interviews, John and Adrian both placed particular emphasis on one key thing, but they called it by different names. John spoke frequently of how it isn’t about the numbers, it’s about the story, and that our job as both researchers, and readers of education research, is to get to the story in order to understand an influence. Adrian talked about mechanisms, and how, when we see an effect size, or an impact reported, the key question that we should be asking is ‘what’s the mechanism behind that finding?’
John spoke about how he’s moved away from ranking effect sizes, he stated ‘It worked, and I did it, then it stopped working, so I stopped doing it’. But I think we’ve got to take the final step and stop reporting them all together, as they give a false sense of security and finality that from the above examples is shown to be unjustified, misleading, and even dangerous in the hands of policy makers. Fundamentally, if effect sizes, a simple number, aren’t reliable enough to rank influences (as John asserts), then what purpose do they serve? John suggested that they can be used to identify which stories to delve deeper into, or which mechanisms to explore, but at the heart of it, this is a form of ranking too. I’m searching for a value in them beyond comparing approaches within a very specific and defined set of assumptions, but I’m struggling to see any.
One of the key principles that I’ve started to apply to education more and more in the past year or so is the idea of opportunity cost. Each time we spend time, money, and resources on one thing, we take these resources away from another thing. Thus, when we spend time, money and resources on aggregating effect sizes, we’ve reduced the time, money, and resources we have available to explore the story. Each time we flash an effect size upon on a powerpoint, we’re taking time and cognitive space away from considering the mechanisms behind an intervention’s efficacy.
John asked ‘What’s the alternative when you’re trying to synthesise literature?‘, and suggested that ‘since I started this, I think it’s 1989 was the first article, no-one’s taken the data and invented a different story.’ but I’d challenge that. I think there’s a fantastic wealth of literature out there that explores educational research, synthesises findings, examines mechanisms, comments on the strength of evidence, and even compares and contrasts the relative impacts of different approaches, all with little to no mention of effect sizes. If you’d like to explore some of this research, I’d encourage you to peruse the exemplary list of Teaching and Learning Research Summaries: A collection for easy access, expertly curated by Tom Sherrington, along with the Institute for Education Science’s Organizing Instruction and Study to Improve Student Learning.
Epilogue
And so it was that I came to the conclusion that combining effect sizes from multiple studies, then using these aggregated effect sizes to try to determine ‘what works best', equates to a category error. As I was reading back over this post, I asked myself the following, ‘Has an effect size ever helped me to be a better teacher?' I honestly couldn't think of an example that would enable me to answer ‘yes' to this question. If you're reading this, and you can answer this question with a ‘yes' and an example, please email me about it, I’m always open to having my mind changed. But if for you, like me, the answer is ‘no', then let’s agree to stop basing policy decisions, teacher professional development, or anything else in education upon comparisons of effect sizes. As both John and Adrian suggest, let's focus on stories and mechanisms from now on.
The meta-analysis and studies on phonics that I referred to
- Ehri, L.C., Nunes, S.R., Stahl, S.A. & Willows, D.M. (2001) Systematic phonics instruction helps students learn to read: Evidence from the National Reading Panel’s meta-analysis. Review of Educational Research. 71 (3), 393–447.
- Blachman, B.A., Tangel, D.M., Ball, E.W., Black, R. & McGraw, C.K. (1999) Developing phonological awareness and word recognition skills: A two-year intervention with low-income, inner-city children. Reading and Writing. 11 (3), 239–273.AndBrown, I.S. & Felton, R.H. (1990) Effects of instruction on beginning reading skills in children at risk for reading disability. Reading and Writing. 2 (3), 223–241.
2 Replies to “Effect Sizes, Robust or Bogus? Reflections from my discussions with Hattie and Simpson”
Comments are closed.